Debug tree
In WideQuick modular framework theres a built in debugg tree to help with system integration. This makes it easier to identify faults and understand possible errors. In this guide we will take a closer look on how to manuver the debugg tree.
Access the debug tree in MOD
The debugg tree is accessible in WideQuick Runtime and can be reached through "Inställningar" -> "Inställningar" and pressing the DebugTree
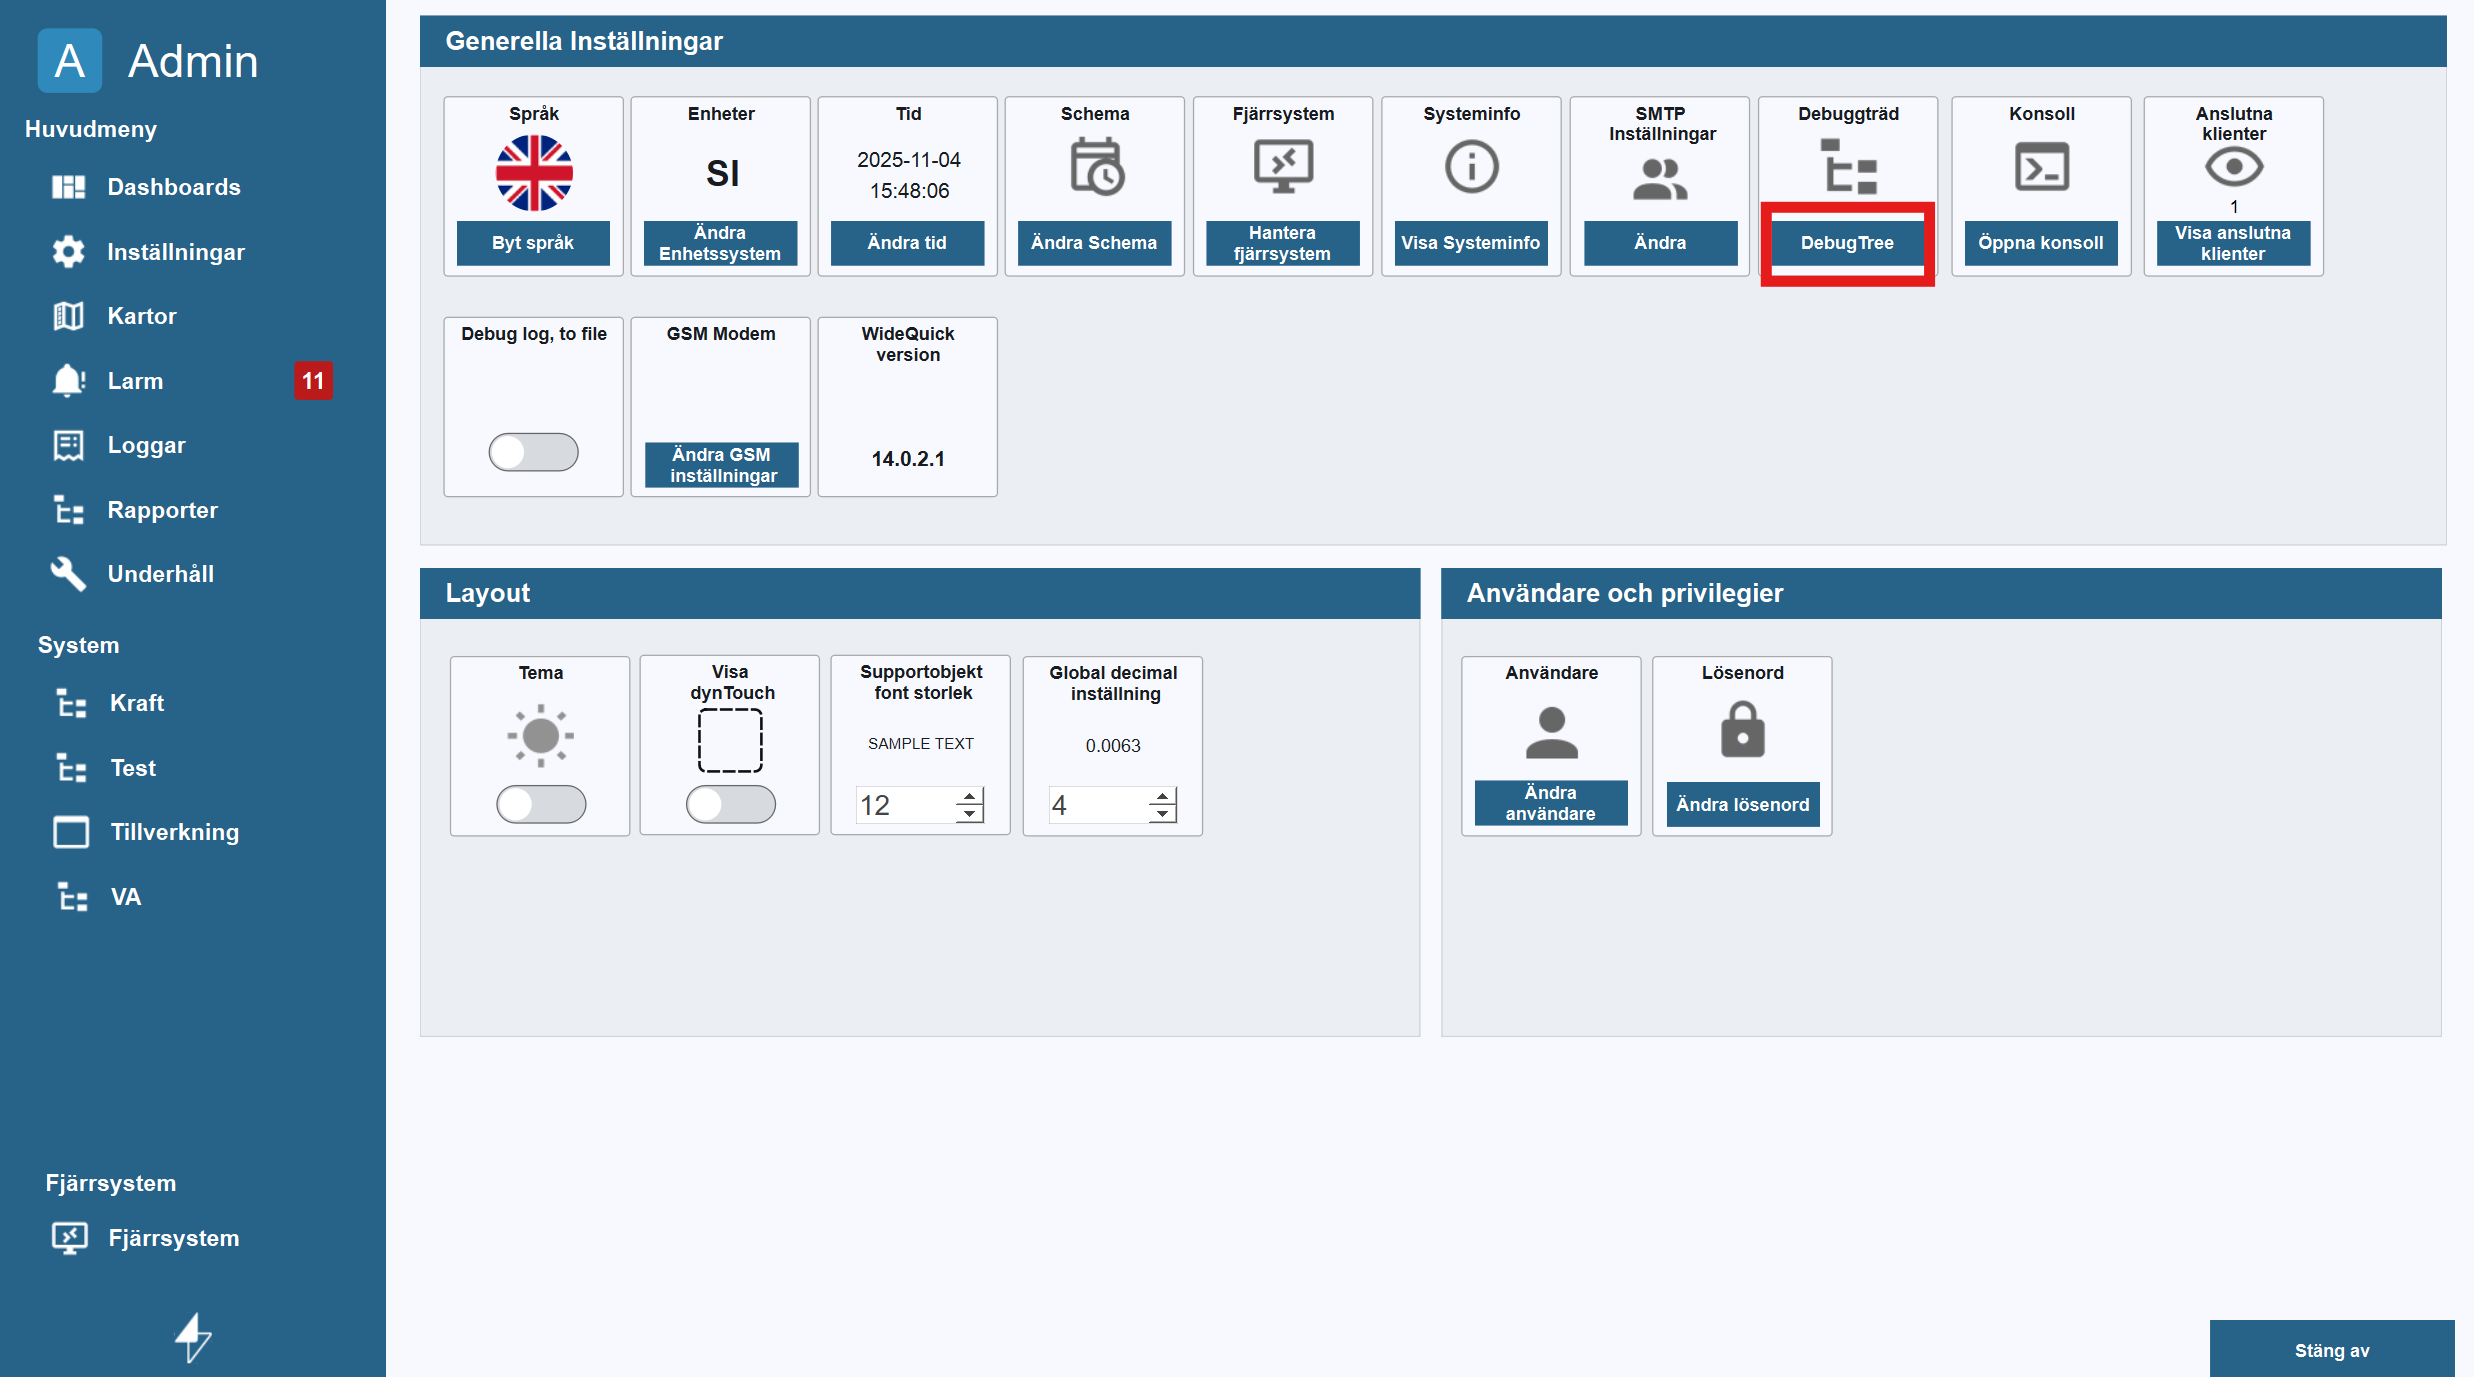
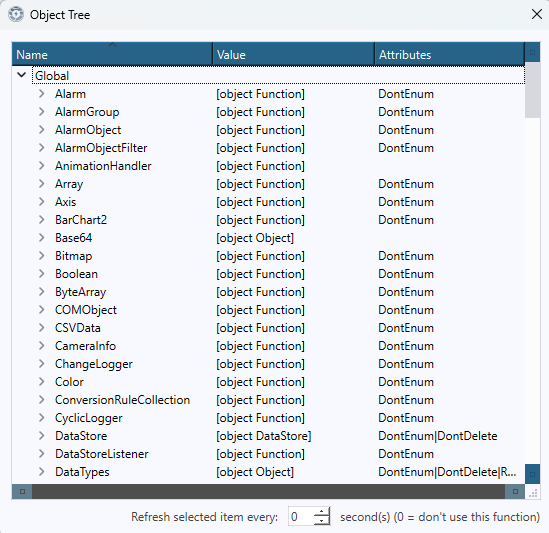
The debugTree will look like this:
Alternative you can left click the kentima logo in the bottom right. This will open the debuger. Here the user can accese the consol as well as the DebugTree.
Debug a WorkView
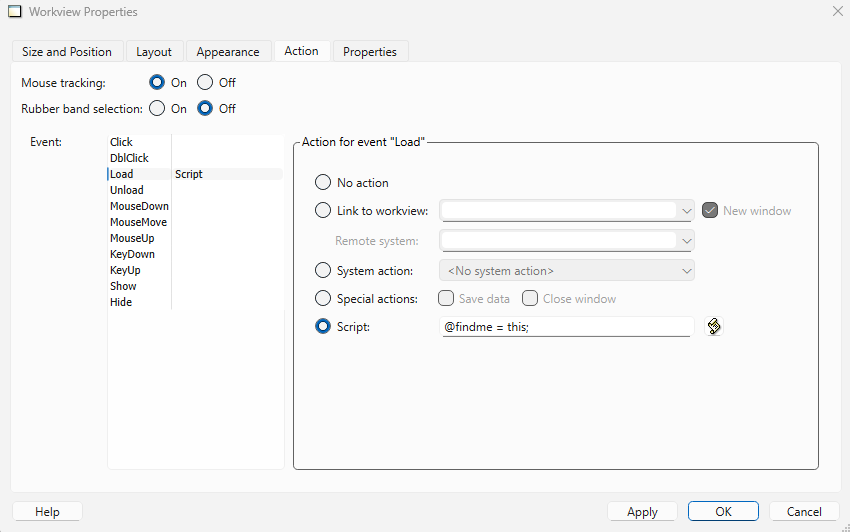
If you want to Debug a certain workview, this can be simplyfied by changing the workviews properties in WideQuick Designer. Right-click the desiered workview in the project tree and select "Properties...". This will bring up the properties for that workview. Go to Action and select the event "Load". In the action for load enter the script which can be seen in the image below. This will make the workview appear at the top of the debuger.
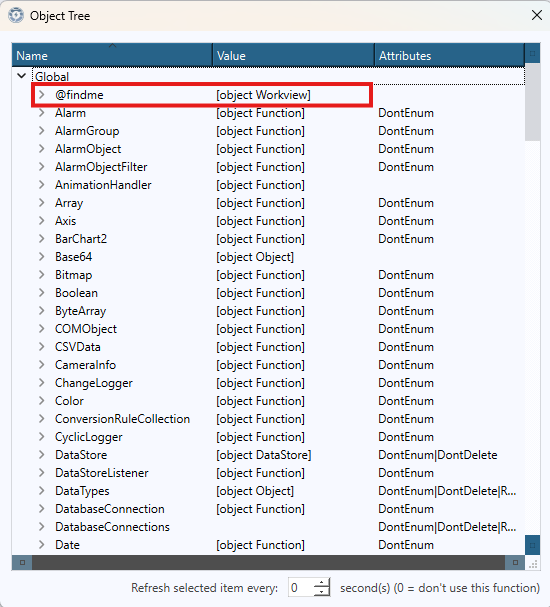
When the propertie is set, open WideQuick Runtime and go to the configured workview. Once there open the debugtree. Now that workview will appear at the top under the name "@findeme". If you already had the debugTree open and it dosent appear. Change the refresh time at the buttom to 1 second and it will appear.
This is very usefull when troubleshooting a workview as the debug tree shows what objects are accessible and where. In this example below we are going to creat a text box which font color will be set to be the same as another objects line color in the group. This example will focus on how to navigate the debug tree and what it means.
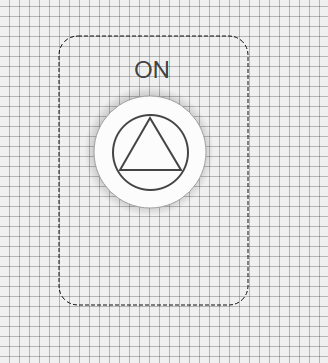
In the image below we have created a group with a text box, a motor fan symbol and a dyn touch. We have also configured the workviews propertie so it shows up as "@findeme" in the debug tree.
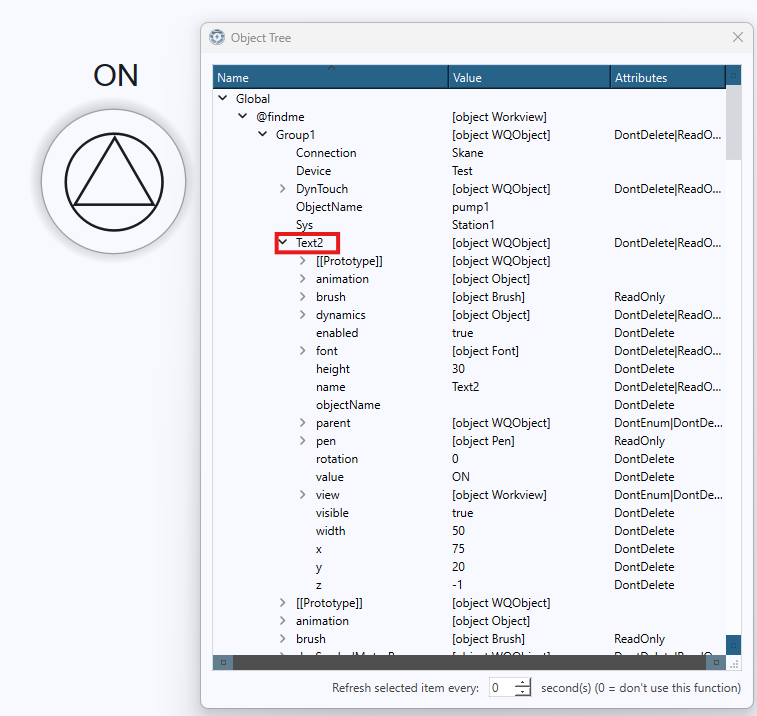
So within WideQuick Runtime we can find our workview in the debug tree at the top under the name "@findeme". We can now navigate from here to our text box which we are going to configure. In the image below we have located our textbox in the debug tree. From here we are able too see what values and objects it has acces to and how it can acces it.
From this location we are now going to find the path to a specific object value, which we want the text box font color to be the same as. In this example the object is a Triangles pen color, which is nestled into object. The gif below will show how it's located while the scrip box below that will show the path in text form.
| Textbox Dynamics - Color script | |
|---|---|
1 | |