Maps & Indicators - Configuring
This section covers how to configure the more advanced Map Indicators, including Pin Status, Cluster Pins, Lines, and Filters. For setting up a Map View object and adding basic indicators, see Maps & Indicators — Get started.
Configuring indicators
The following indicators are available in the Map Indicators object library and are added the same way as described in Maps & Indicators — Get started. Each indicator has properties that must be configured to function correctly — these are described in the sections below.
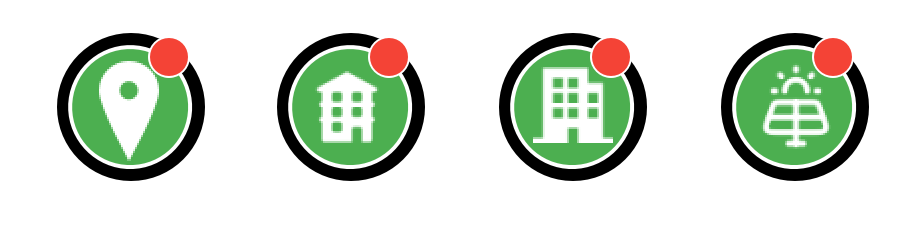
Pin Status
Pin Status objects are the key to connecting a Map View to Workviews. They are
implemented the same way as a regular pin, but with more logic behind them. When
successfully linked to a Workview, they allow the user to navigate directly to that
Workview on click. The background colour of the pin also displays the live status
of the Workview — whether it is active, has a warning, or has an alarm. The pin can
additionally display the number of active alarms and warnings. Together, these features
make PinStatus objects the foundation for system control through a map.
Note
To display a different icon on the PinStatus object, change its SVG or make a
copy of the object and change the SVG on the copy.
To integrate an Alarm object with a map and status pins, see Connecting Alarm to Map View.
Cluster Pins
Cluster pins can be used to group underlying pins into one, reducing clutter on the map and improving navigation. A cluster pin is created the same way as a regular pin, but with additional properties.
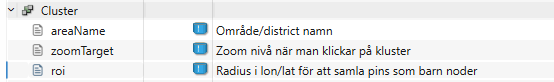
The following properties must be configured:
- areaName — The name shown in the tooltip, helping the user with navigation.
- zoomTarget — Controls the zoom level when the pin is pressed. In combination with the map's zoom ranges, this results in seamless navigation — showing the child pins when pressed and hiding the cluster pin.
- roi — The core of the cluster pin. Determines the range within which the cluster collects other pins as its children. If a pin falls within the roi of two cluster pins, the closest one will claim it as its child.
The cluster pin also reflects the status of its children through its background colour and displays the number of connected children.
To enable cluster pin functionality, add the following to the Map View onLoad script:
scMap.mapView = this;
scMap.initClusters(this);
if (scMap.alarmList) scMap.updateAlarmList(this, scMap.alarmList);

Lines
Lines are useful for visualising paths or pipes in an application. Since pipes span
multiple coordinates, they require more configuration than other indicators. Lines come
in three sizes: SmallPipeLines, MediumPipeLines, and MainPipeLines.
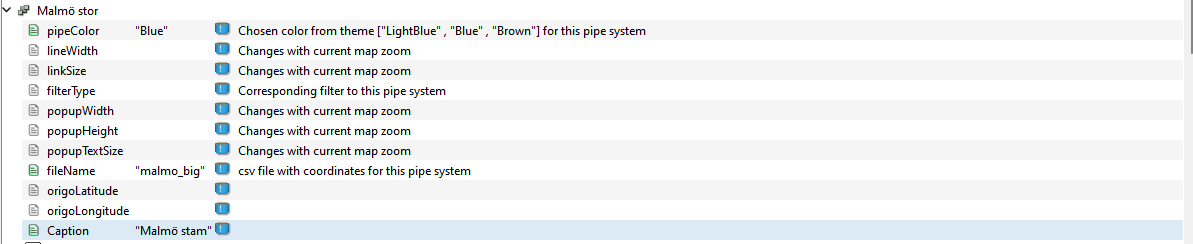
The following properties are available:
- pipeColor — The colour of the line. Colors can be selected from the mapIndicators theme, which can be found in the project tree under Themes. To add custom colours, add them to the mapIndicators theme and reference the colour name here.
- lineWidth (optional) — Alters the line width. This value is affected by zooming, so it acts as a start value rather than a constant.
- linkSize (optional) — Each line segment is connected by an ellipse called a Link. Alters the size of the Link.
- filterType — Used by the application to filter different networks. This does not need to be filled in manually.
- popupWidth (optional) — The width of the popup.
- popupHeight (optional) — The height of the popup.
- popupTextSize (optional) — Alters the font size of the popup text.
- fileName — Points to the CSV file containing the coordinates for the line network. There is a maximum of 50 segments per network.
- origoLatitude (optional) — Specifies a start point latitude for the network.
- origoLongitude (optional) — Specifies a start point longitude for the network.
- Caption — The header displayed in the map indicator.
Example configuration:
CSV file with coordinates
To link a line network to a CSV file, create the file in the mapPaths folder in your
project directory. If this folder does not exist, create it.
The CSV uses two columns separated by a comma — latitude and longitude — defining the path from start to end. The following example covers a network over Malmö, Sweden:
lat,long
55.60993454611365,13.067280081496149
55.60754066940655,13.068012894315629
55.59706293405991,13.064900367032141
55.586229083148936,13.06210645824121
55.575010991019305,13.049196672585212
55.56406209265025,13.023184417468679
55.56771206450431,12.986285551858925
55.57070805669029,12.948037902764336
55.58835253553419,12.947941561647154
55.597117367875725,12.970678198813472
55.603812162853316,12.994474594377622
55.607077501929616,13.02193197387472
55.607186342050994,13.0452466622596
55.61529406922991,13.083397968508196
To link the CSV to a line group such as MainPipeLines, set the fileName property
to the filename:

Filter
Filters allow users to focus on a specific set of lines or networks by toggling their
visibility. Any line network is automatically registered with the filter, so no
additional configuration is needed. Add a Filter object to your view the same way
as any other object.
Next Steps
- Extending — creating custom map indicators