Control Curve Time
The Control Curve Time popup is a time-based control curve editor that maps time of day on the X-axis to output values on the Y-axis using a set of draggable nodes connected by lines. It is used to configure output values that vary throughout the day — for example varying a pressure setpoint or monitoring expected process values across a 24-hour period. It only appears in the Tab menu when the object has signals matching the configured suffix aliases.
For the standard control curve where the X-axis is a numeric process value rather than time, see Control Curve
Control curve graph
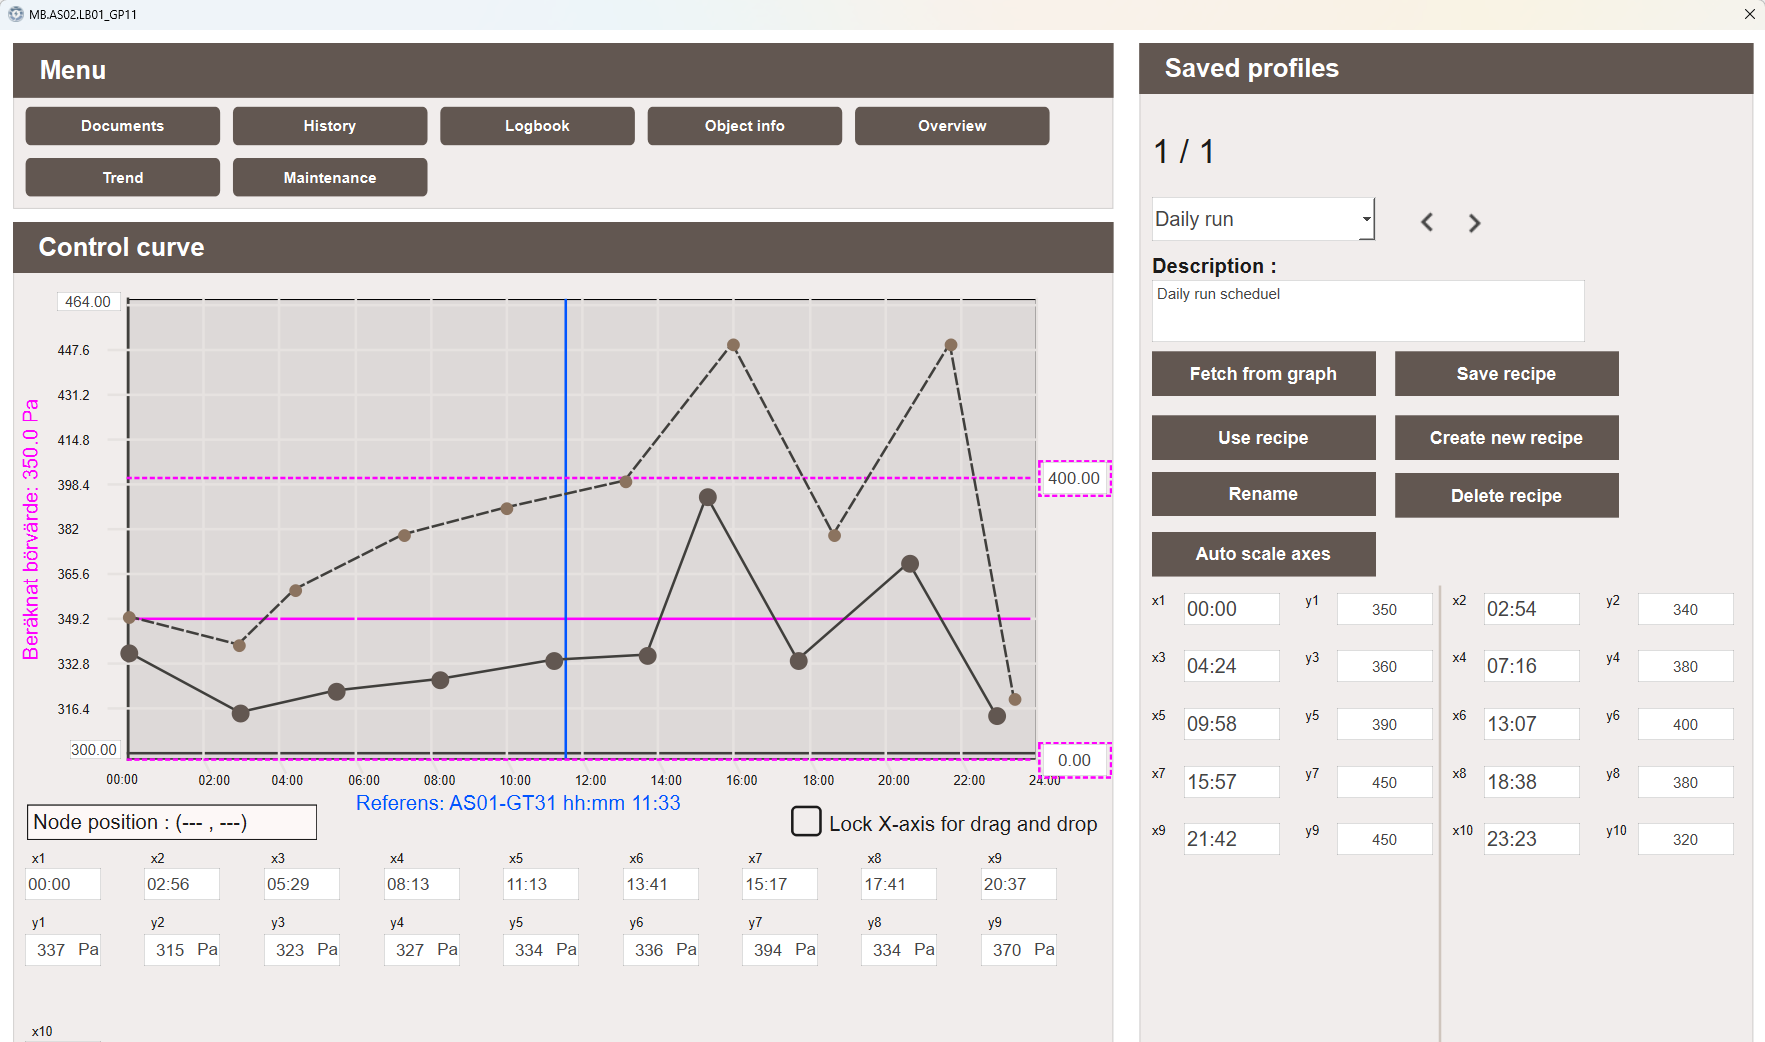
The Control curve graph displays the current curve as a series of nodes connected by lines across a fixed 00:00 to 24:00 time axis. A blue vertical line marks the current time of day, and a pink horizontal line shows the current actual process value for reference.
When a saved profile is loaded, it is displayed as a dashed line alongside the live curve, allowing the two to be compared before the profile is applied. The pink dashed border shows the configured Y-axis clamp range (see Clamp range).
Nodes on the live curve can be dragged to adjust the curve shape, or edited directly in the data point table below the graph.
- Node position — displays the current time and Y value of the selected node
- Lock X-axis for drag and drop — when enabled, nodes can only be moved vertically, preventing accidental changes to the time values
- Data point table — shows the time and Y values for each node with their units. Values can be edited directly in the table as an alternative to dragging
Clamp range
A clamp range sets hard Y-axis limits on the curve. When a clamp is configured, nodes cannot be moved above the maximum or below the minimum clamp value, restricting edits to a defined operating band.
The clamp boundaries are displayed as a pink dashed border on the graph.
Clamp values are stored as part of the profile and are saved and loaded with it.
The Clamp min and Clamp max fields in the profile panel require the
ControlCurve_EditProfiles privilege to edit.
Saved profiles
The Saved profiles panel allows curve configurations to be saved, loaded, and managed. This makes it easy to switch between different daily schedules or restore a known configuration.
The following actions are available:
- Fetch from graph — loads the current live curve values into the profile editor for preview or saving
- Save recipe — saves the current profile editor values as a named profile to the database
- Use recipe — applies the currently loaded profile to the live curve
- Create new recipe — creates a new empty profile slot
- Rename — renames the currently selected profile
- Delete recipe — deletes the currently selected profile from the database
- Auto scale axes — automatically adjusts the Y-axis range to fit the current data
Default suffix aliases
The Control Curve Time popup supports up to 17 time-based curve points
(_FS_X0/_FS_Y0 through _FS_X16/_FS_Y16). The X-axis is fixed to
00:00–24:00 and cannot be changed.
| Suffix | Writable | Description |
|---|---|---|
_FS_X0, _FS_Y0 |
No | Anchor point — read-only reference values |
_FS_X1–_FS_X16, _FS_Y1–_FS_Y16 |
Yes | Editable curve points, requires ControlCurve_ManualControl privilege |
_FS_yMin |
Yes | Minimum Y-axis value |
_FS_yMax |
Yes | Maximum Y-axis value |
Note
Writing to curve points requires the ControlCurve_ManualControl privilege.
Users without this privilege can view the curve but cannot modify it.