History
The History popup displays a trend graph for the selected object, showing the historical values of its logged signals. It is always visible in the Tab menu regardless of which suffixes the object has. For more information on how the history system works, see History.
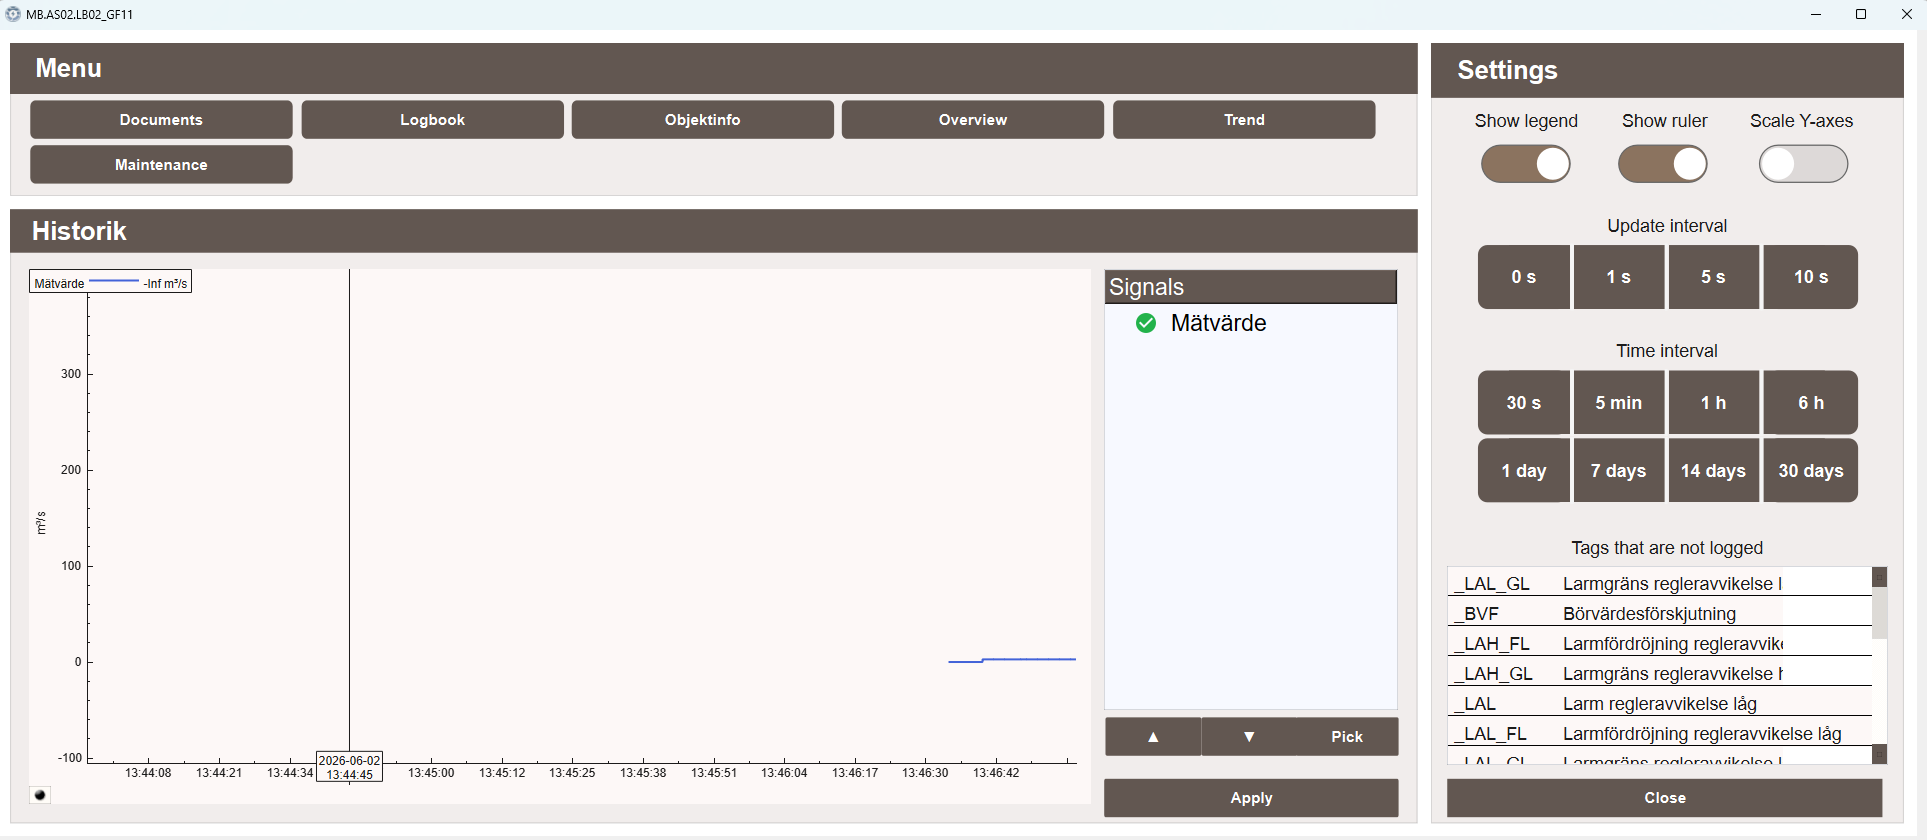
Signals
The Signals panel on the right lists all signals belonging to the object that are currently being logged. Signals can be toggled on and off in the graph using the arrow buttons, and the Pick button allows manual selection. Click Apply to update the graph.
Signals that belong to the object but are not being logged are listed separately under Tags that are not logged in the bottom right panel.
Graph
The graph displays the historical values of the selected signals over the chosen time interval. The Y-axis unit is derived automatically from the signal's suffix alias configuration.
Settings
The Settings panel on the right provides the following options:
- Show legend — toggles the signal legend on the graph
- Show ruler — toggles a vertical ruler that can be dragged along the time axis to inspect values at a specific point in time
- Scale Y-axes — toggles automatic scaling of the Y-axis to fit the visible data
Update interval
Controls how frequently the graph refreshes with new data:
- 0 s — updates continuously
- 1 s — updates every second
- 5 s — updates every 5 seconds
- 10 s — updates every 10 seconds
Time interval
Controls the time span displayed in the graph:
- 30 s, 5 min, 1 h, 6 h
- 1 day, 7 days, 14 days, 30 days