Trend
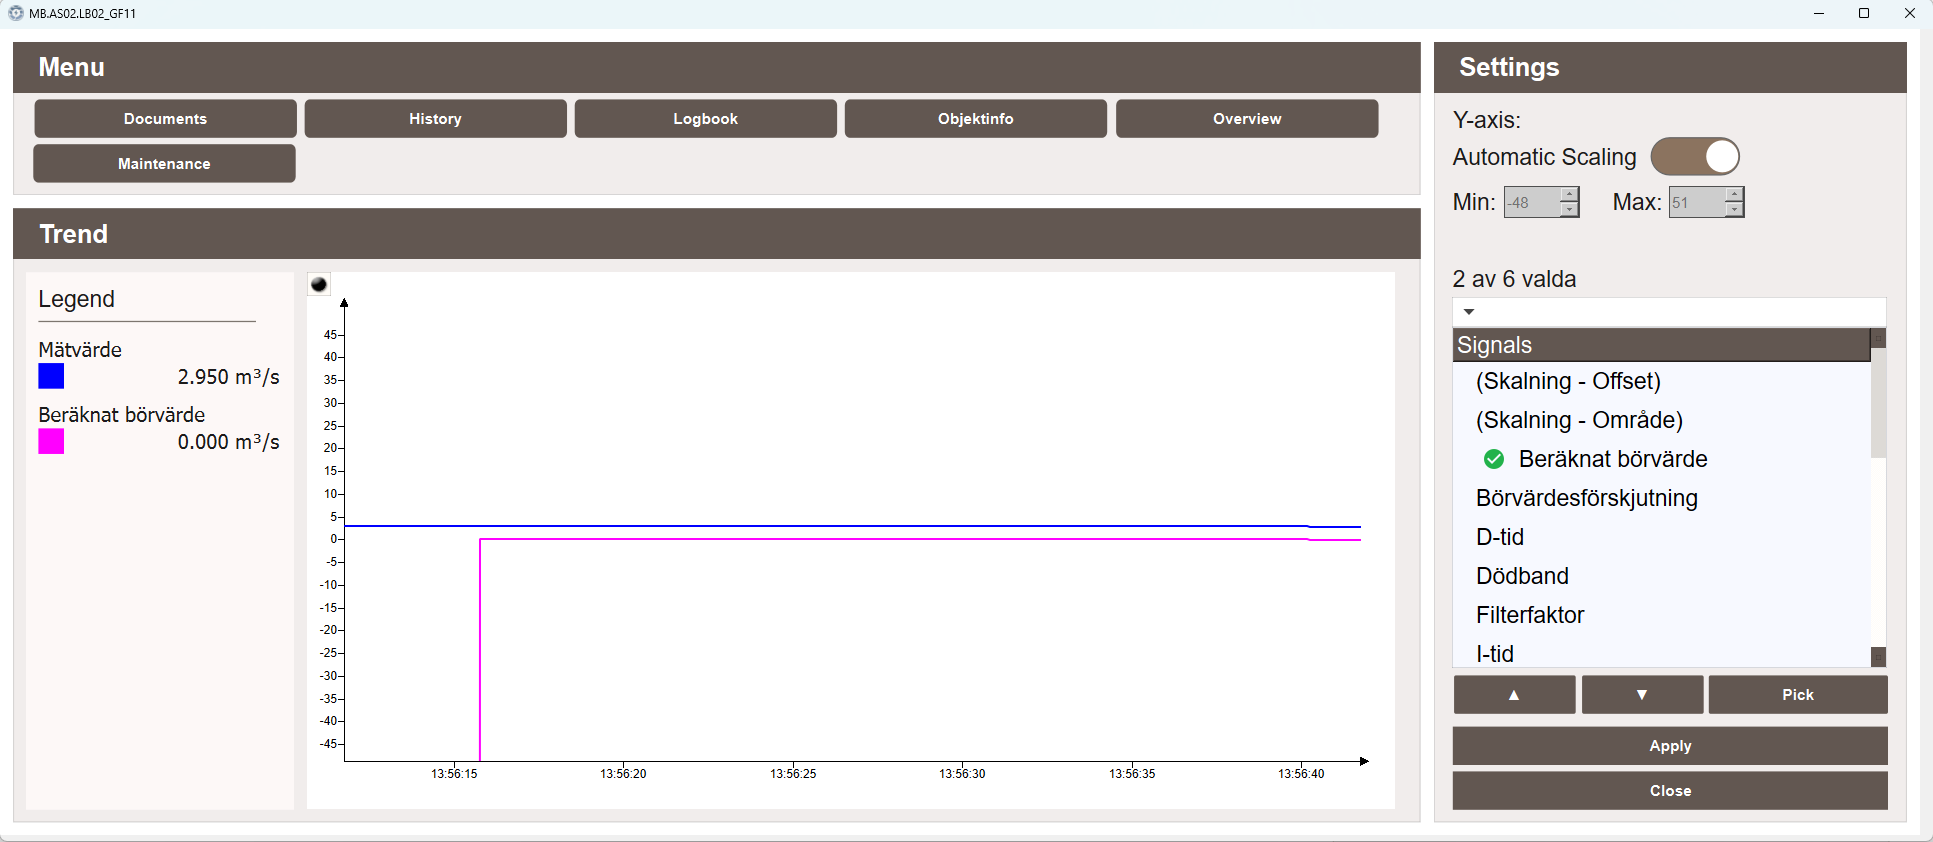
The Trend popup displays live signal values for the selected object in a real-time graph. Unlike the History popup which is limited by how frequently signals are logged, the Trend popup reads directly from the Data Store and updates continuously. It is always visible in the Tab menu regardless of which suffixes the object has.
Graph
The graph displays the live values of the selected signals over time. A legend on the left shows the name, color, and current value of each active signal.
Signals
The Signals panel on the right lists all signals available for the object. Selected signals are marked with a green checkmark. Use the arrow buttons to navigate the list, Pick to select a signal, and Apply to update the graph. The panel shows how many signals are currently selected out of the total available.
Settings
The Settings panel provides Y-axis configuration options:
- Automatic Scaling — when enabled, the Y-axis scales automatically to fit the visible data. When disabled, the Min and Max values can be set manually.
- Min — the minimum value shown on the Y-axis when automatic scaling is disabled.
- Max — the maximum value shown on the Y-axis when automatic scaling is disabled.