Control Curve
The Control Curve popup is a control curve editor that maps input values on the X-axis to output values on the Y-axis using a set of draggable nodes connected by lines. It is used to configure non-linear control relationships — for example mapping an outdoor temperature to a heating valve position. It only appears in the Tab menu when the object has signals matching the configured suffix aliases.
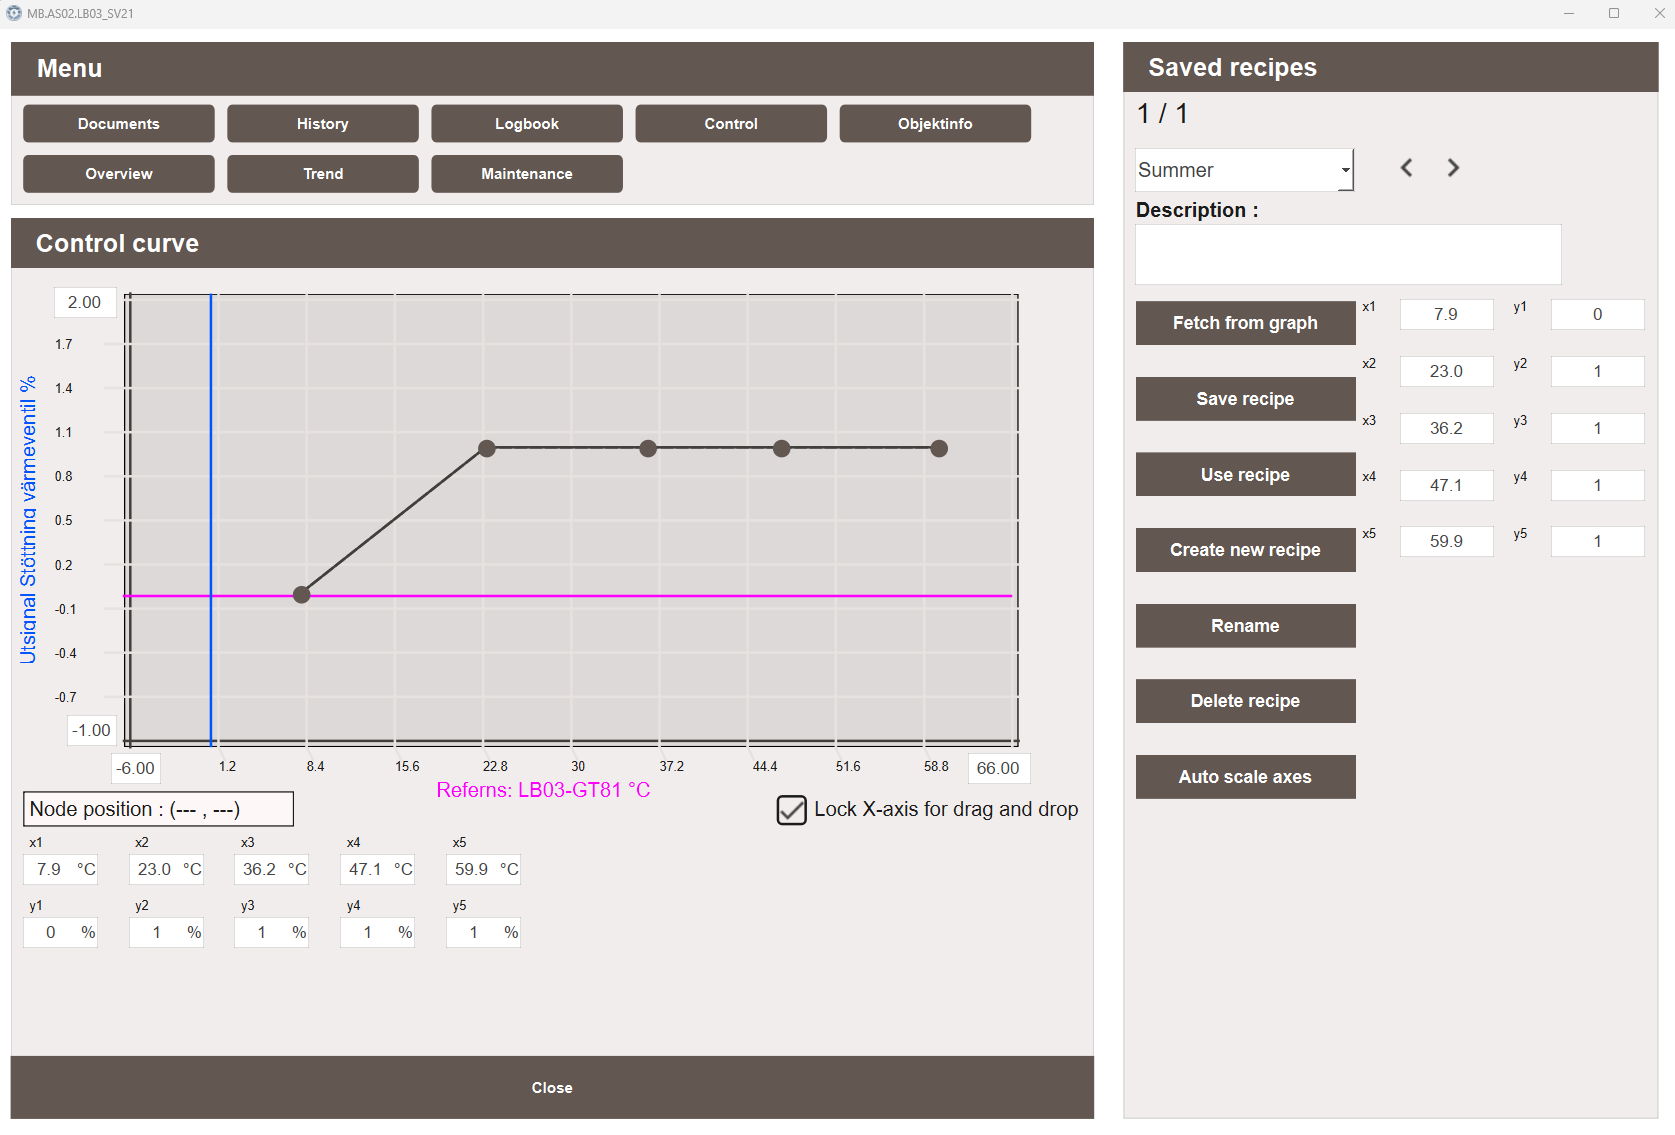
Control curve graph
The Control curve graph displays the current curve as a series of nodes connected by lines. Nodes can be dragged to adjust the curve shape, or edited directly in the data point table below the graph. A reference signal is shown as a horizontal line on the graph, indicating the current input value.
- Node position — displays the X and Y coordinates of the currently selected node
- Lock X-axis for drag and drop — when enabled, nodes can only be moved vertically, preventing accidental changes to the X-axis values
- Data point table — shows the X and Y values for each node with their units. Values can be edited directly in the table as an alternative to dragging
Clamp range
A clamp range sets hard Y-axis limits on the curve. When a clamp is configured, nodes cannot be moved above the maximum or below the minimum clamp value, restricting edits to a defined operating band.
The clamp boundaries are displayed as pink dotted horizontal lines on the graph.
Clamp values are stored as part of the recipe and are saved and loaded with it.
The Clamp min and Clamp max fields in the recipe panel require the
ControlCurve_EditProfiles privilege to edit.
Saved recipes
The Saved recipes panel allows curve configurations to be saved, loaded, and managed. This makes it easy to switch between different control curve setups or restore a known good configuration.
The following actions are available:
- Fetch from graph — loads the current live curve values into the recipe editor for preview or saving
- Save recipe — saves the current recipe editor values as a named recipe to the database
- Use recipe — applies the currently loaded recipe to the live curve
- Create new recipe — creates a new empty recipe slot
- Rename — renames the currently selected recipe
- Delete recipe — deletes the currently selected recipe from the database
- Auto scale axes — automatically adjusts the axis ranges to fit the current data
Default suffix aliases
The Control Curve popup uses X and Y coordinate pairs to define the control curve
points. Up to 19 points are supported (_X0/_Y0 through _X18/_Y18):
| Suffix | Writable | Description |
|---|---|---|
_X0, _Y0 |
No | Anchor point — read-only reference values |
_X1–_X18, _Y1–_Y18 |
Yes | Editable curve points, requires ControlCurve_ManualControl privilege |
_yMin |
Yes | Minimum Y-axis value |
_yMax |
Yes | Maximum Y-axis value |
Note
Writing to curve points requires the ControlCurve_ManualControl privilege.
Users without this privilege can view the curve but cannot modify it.