History - Get started
Requirements
The following scripts are required to use History and all related functionality covered in the History guides:
scHistoryscPrototypesscThemesscAlertscQuickSort
The History module displays logged signal data as interactive line charts. There are three ways to access it: the project-wide History view from the main menu, a view-specific History popup opened from a workview, and the History tab in any object popup.
The History View
The project-wide History view is available from the main menu. It shows signals from across the entire project.
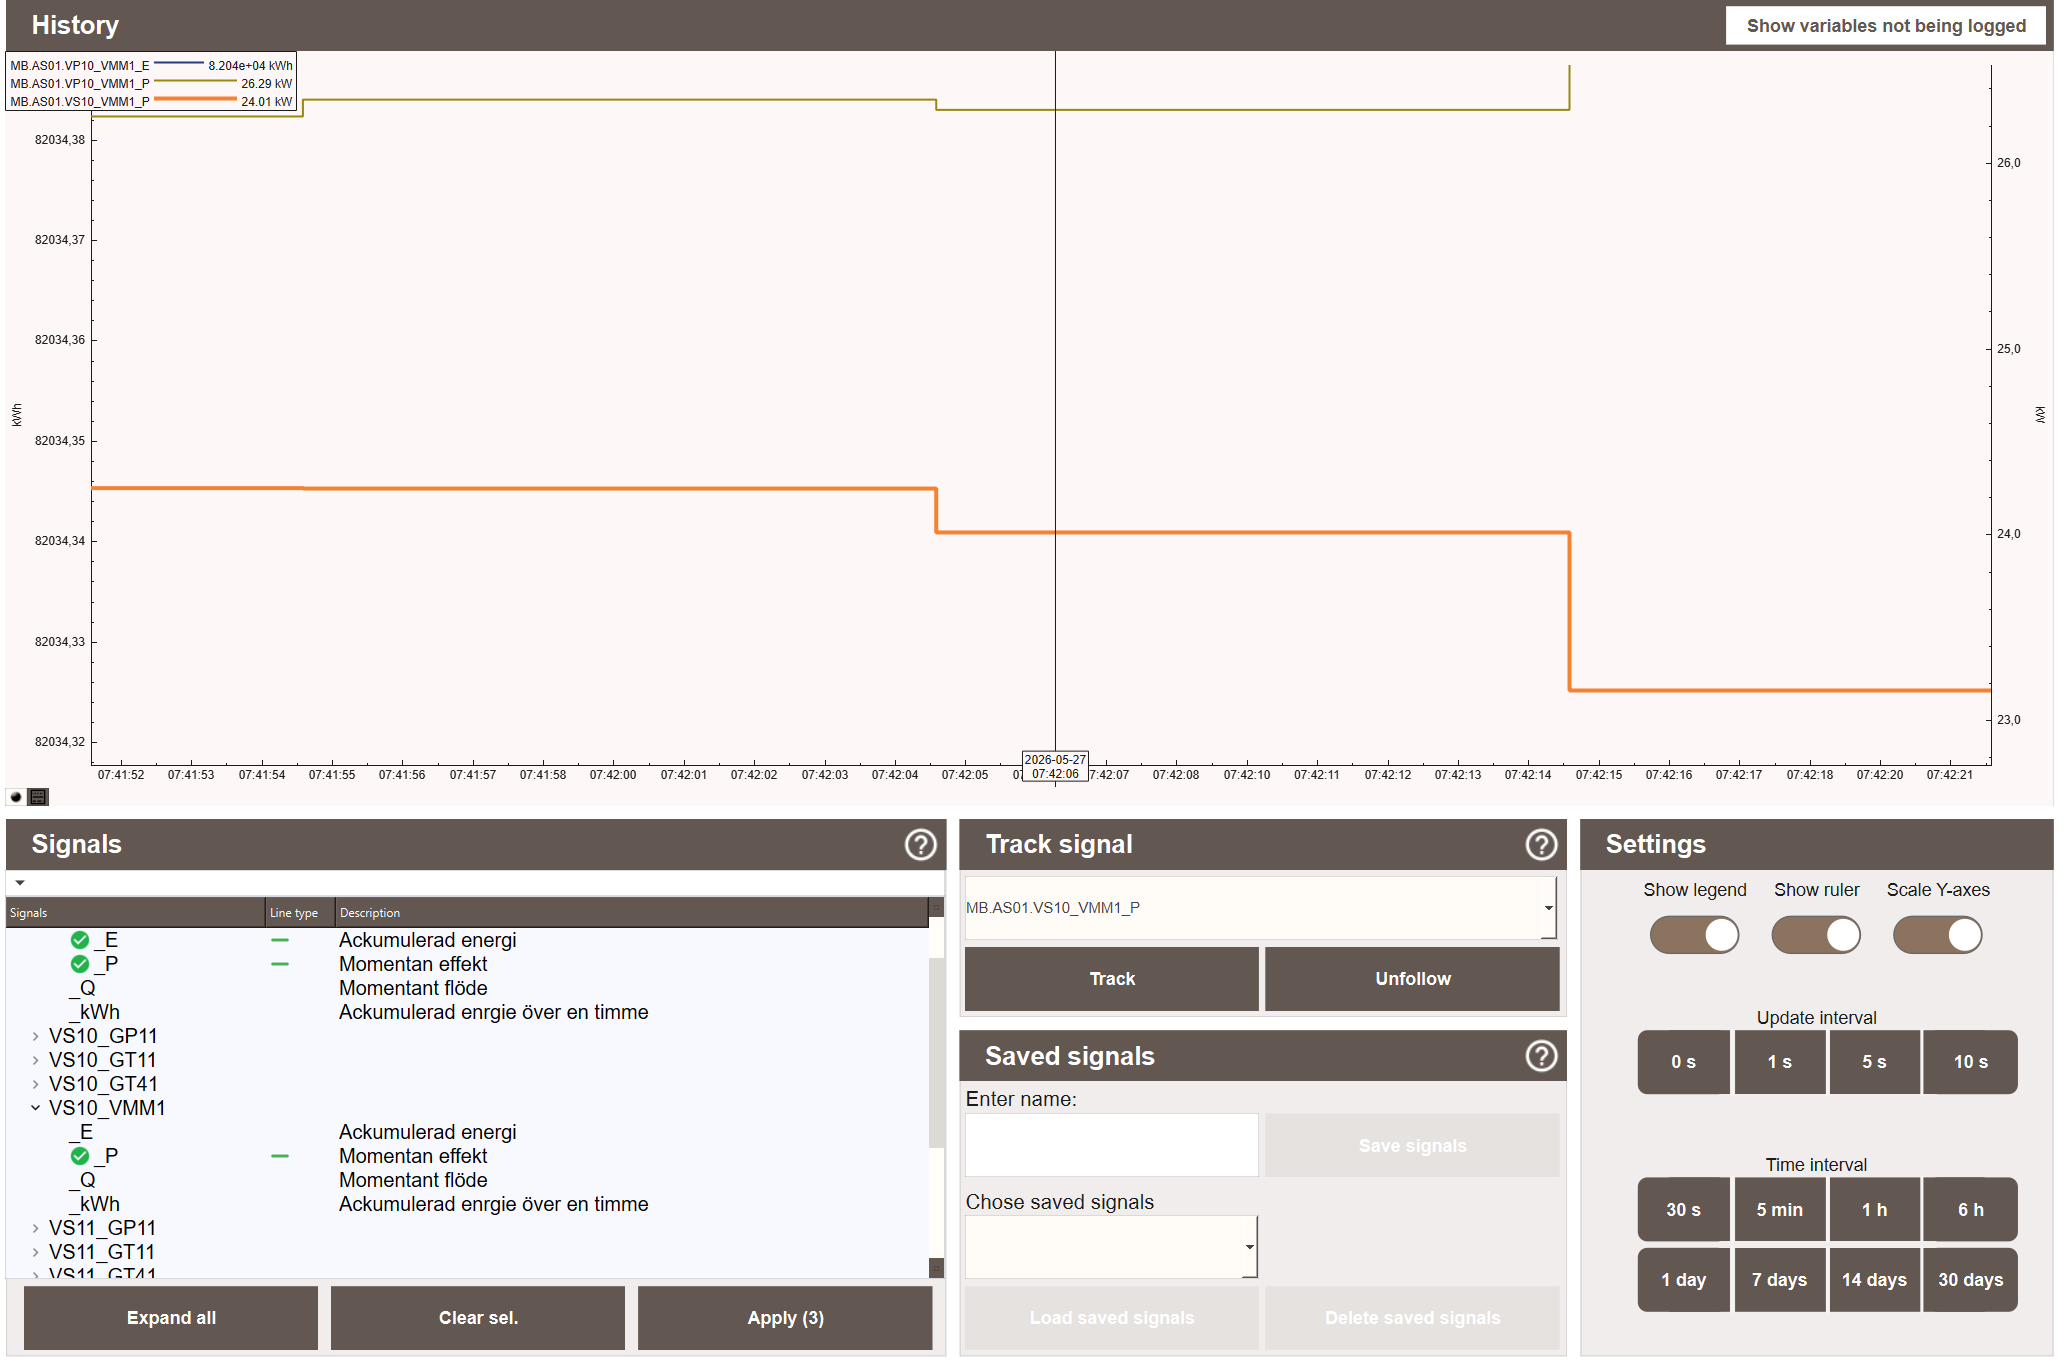
The view has a chart at the top and three panels at the bottom:
- Signals — a tree of all logged signals in the project, grouped by system. Signals are selected here and applied to the chart.
- Track signal — options for tracking a live signal on the chart. Also contains the Saved groups section for saving and loading named signal groups.
- Settings — toggles for legend, ruler and Y-axis scaling, plus time interval and update interval controls.
The Show variables not being logged button in the top-right corner opens a separate window that shows all signals not connected to a logger.
Selecting Signals
- Expand the Signals tree to find the signal. Click Expand all to open all nodes at once.
- Click the signal to select it. Multiple signals can be selected at once. The Apply button shows how many signals are currently selected.
- Click Apply to plot the selected signals on the chart.
- To clear all signals from the chart, click Clear sel.
The second column of the tree shows the line type for each selected signal. Clicking the line type symbol cycles through the available styles (Full or dashed).
Settings
The Settings panel controls how the chart looks and how often it updates.

| Setting | Description |
|---|---|
| Show legend | Toggles the signal legend in the chart area. |
| Show ruler | Toggles a vertical ruler line that follows the cursor. |
| Scale Y-axes | Enables auto-scaling of all Y-axes to fit the visible data. |
Time interval sets how much history is shown:
Update interval sets how often the chart refreshes with new data:
| Button | Description |
|---|---|
| 0 s | No automatic update |
| 1 s | Update every second |
| 5 s | Update every 5 seconds |
| 10 s | Update every 10 seconds |
View-Specific History
The SpeedDial menu on process views includes a button that opens a view-specific history popup. It works exactly like the project-wide view but shows only signals from objects that belong to that view.
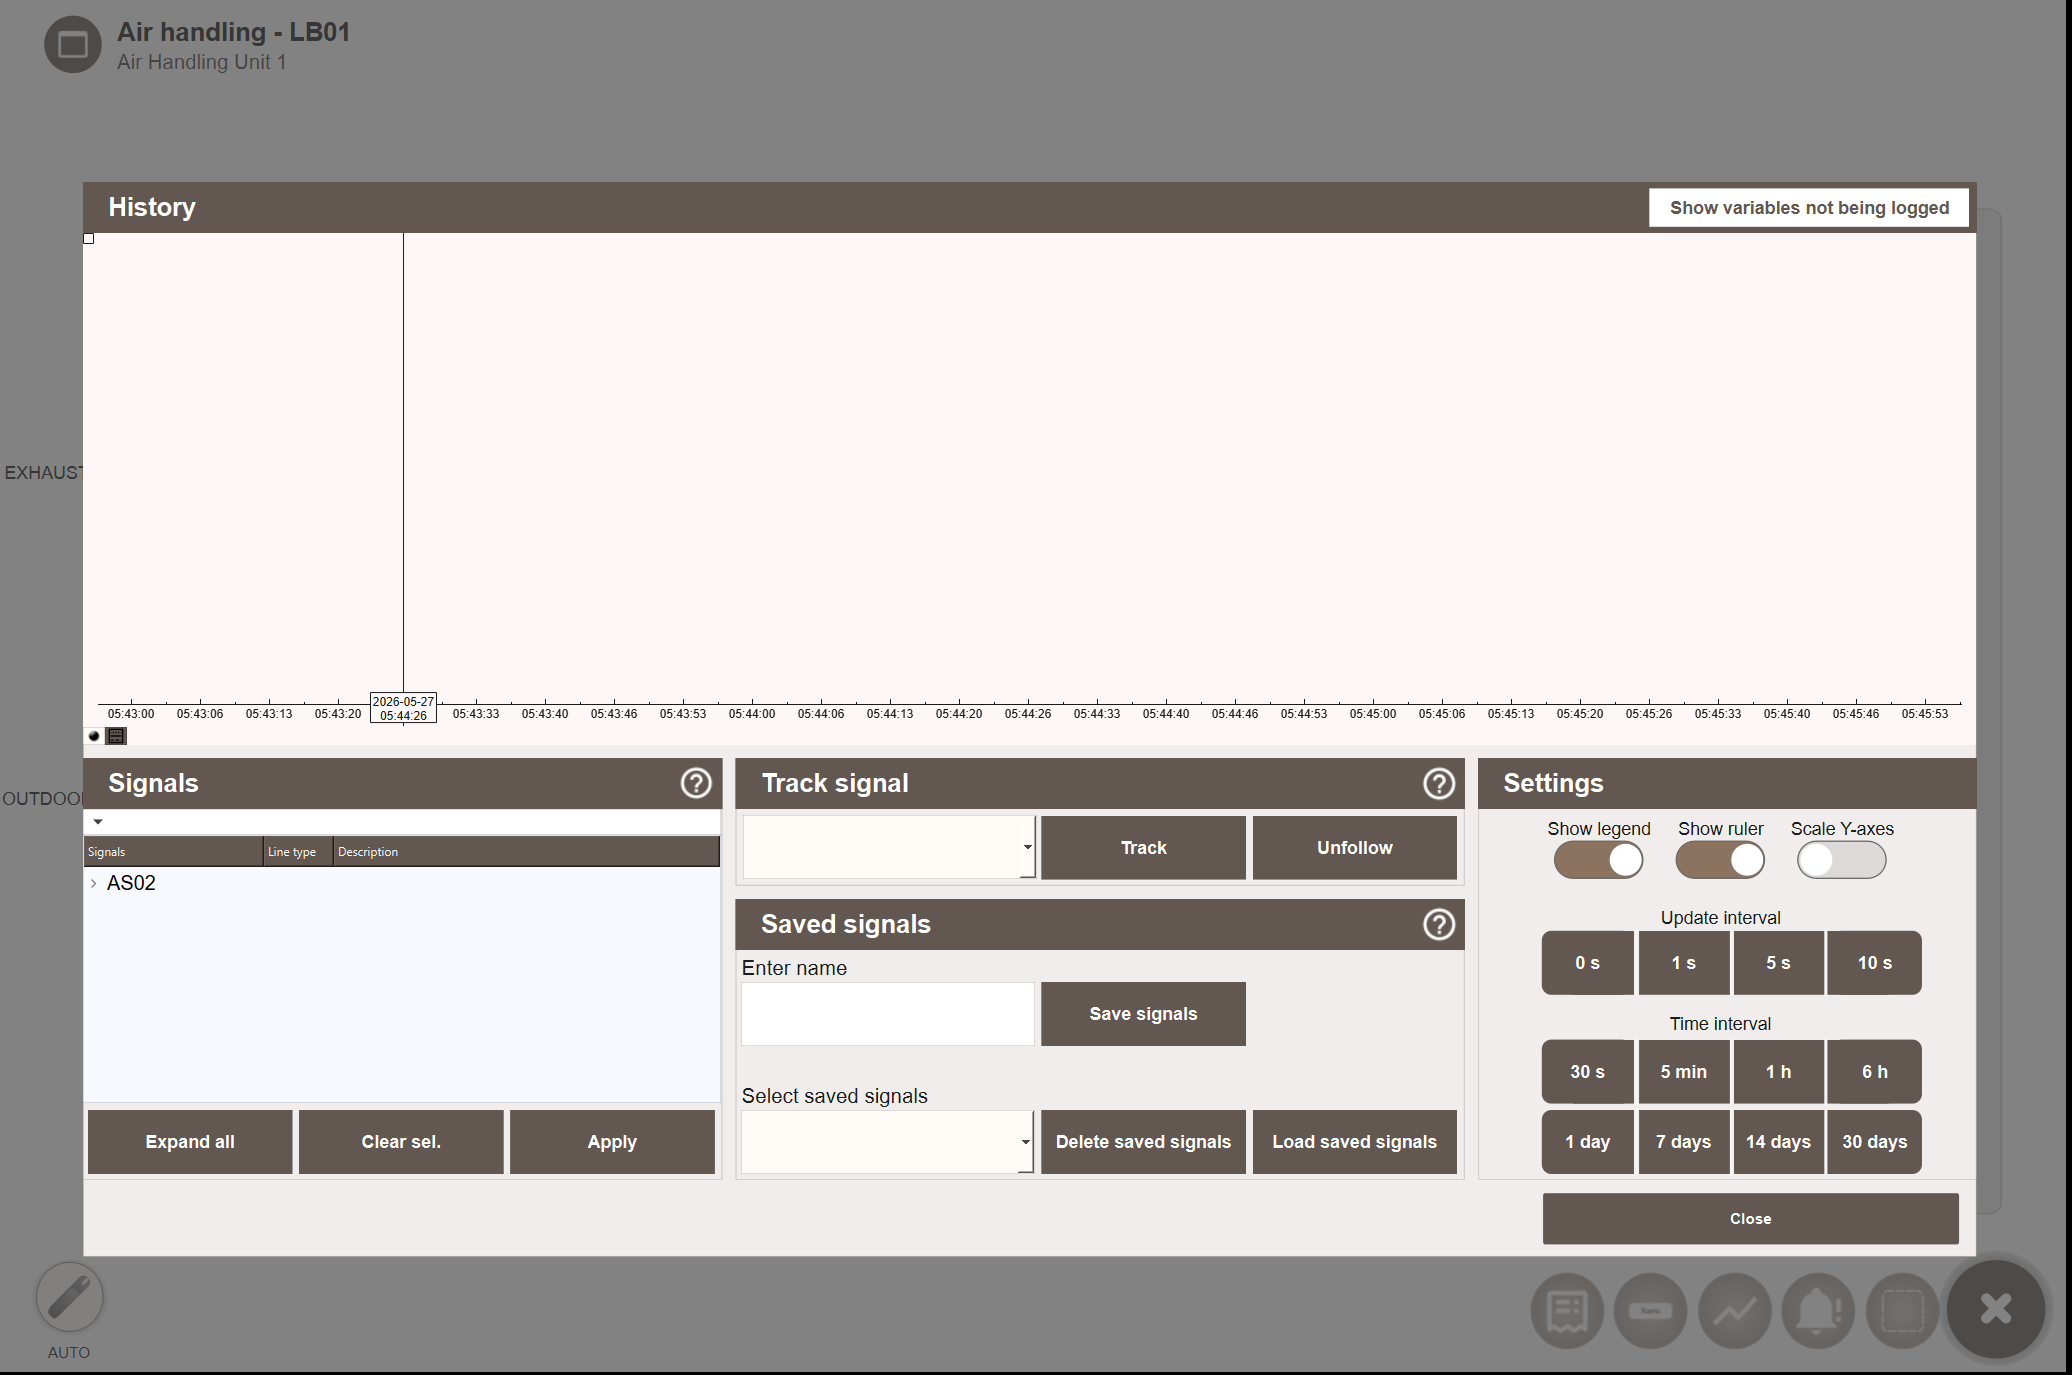
Signal selection, time controls, settings and saved signal groups work the same way. Saved signal groups in this popup are stored per view and are separate from project-wide saved groups. You can also import saved groups from other views using Import groups from views — see Importing Groups from Other Views.
Since the view-specific History only shows signals belonging to the current view, you can bring in signals from other views using Import signals.
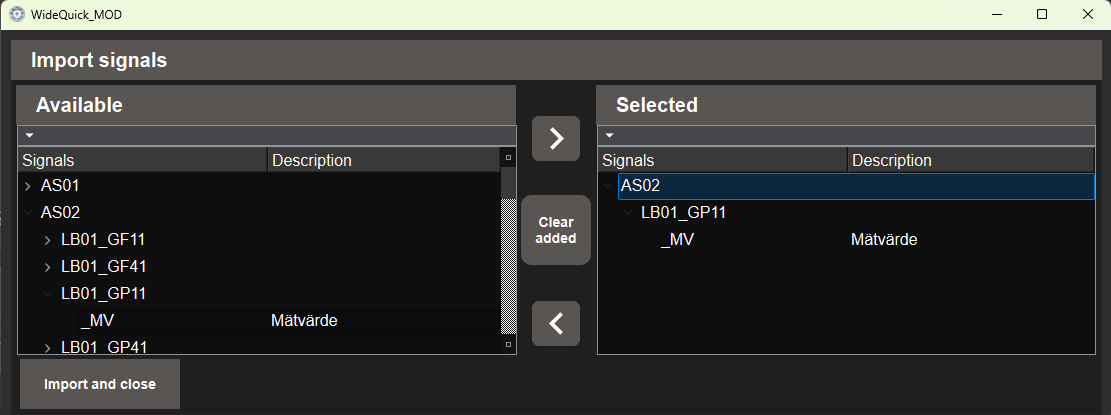
To import signals from other views:
- Click Import signals. A dialog opens showing all signals from all other views, organised by system and object.
- Expand the tree in the Available panel to find the signal you want.
- Select a signal and click → to move it to the Selected panel.
- Repeat for each signal you want to add.
- Click Import and close. The signals are added to the signal list and can be selected and applied to the chart.
To remove a signal from your selection before importing, select it in the Selected panel and click ←. Click Clear added to empty the right panel entirely.
Object Popup (History Tab)
Every object in the project has a History tab in its popup. Opening the tab shows the logged signals for that object in a chart.
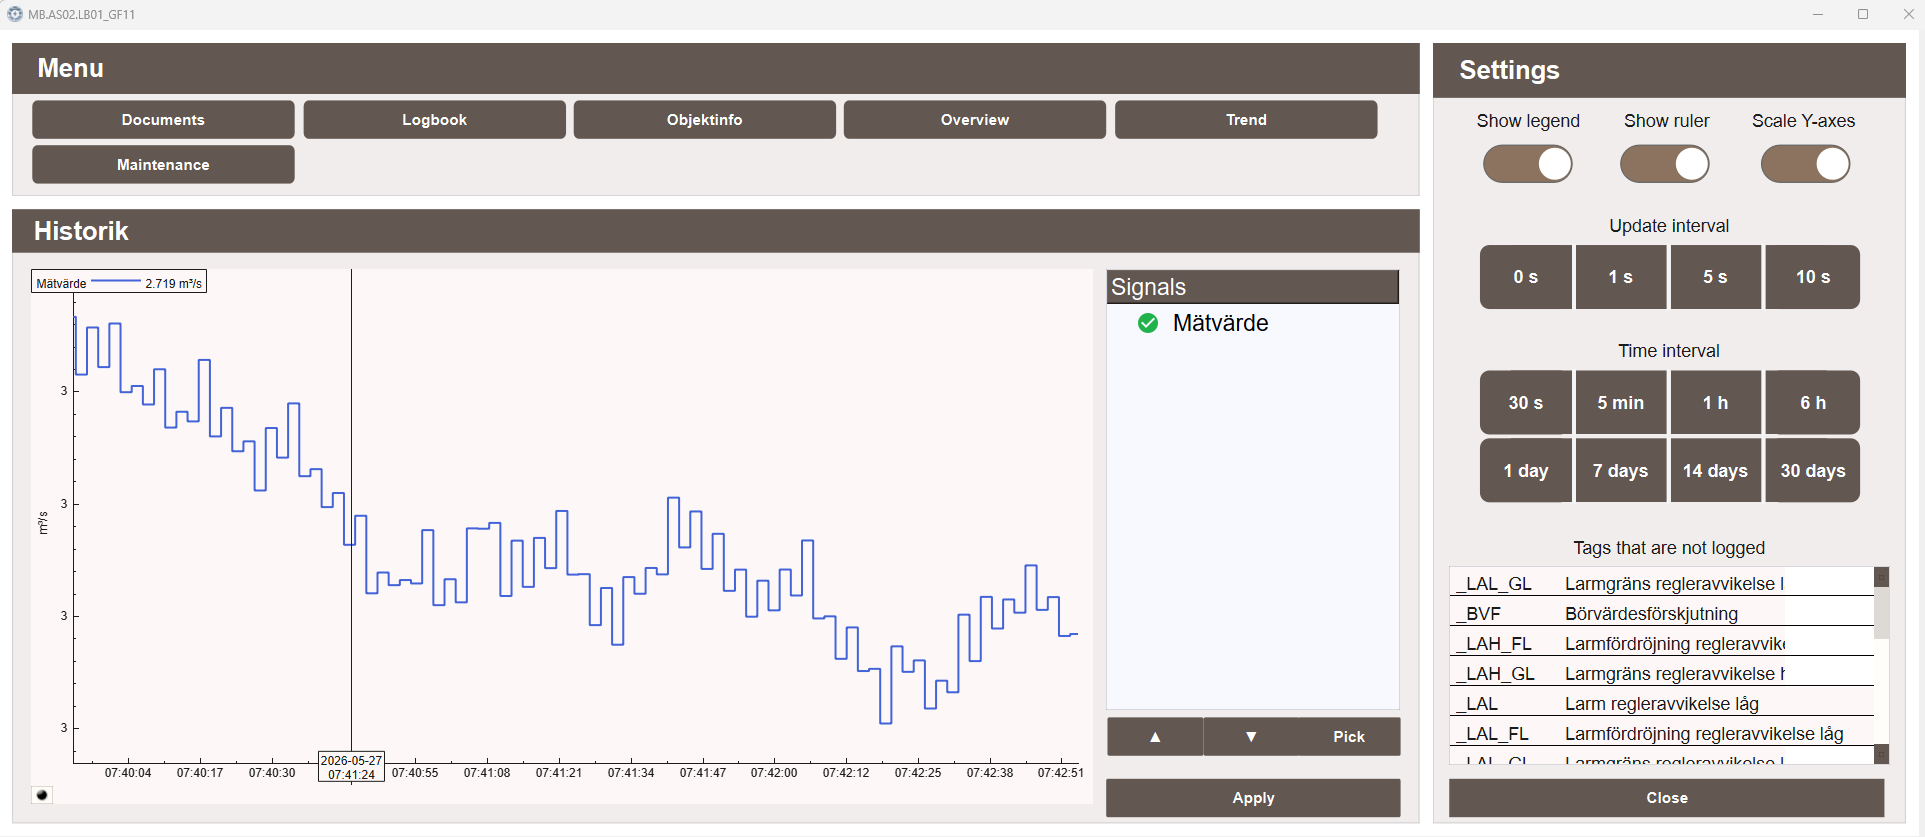
Signals that belong to the object but have no logger configured are listed on the right side under Tags that are not logged.
The signal list supports keyboard navigation using the ▲ and ▼ buttons. Click Pick to select the highlighted signal.
Signals with the suffix _MV (measured value) are selected automatically when the popup opens.
Click Apply to plot the selected signals. Click Close to close the popup.
Next Steps
- Configuring — signal selection, track signal, saved groups and chart settings in detail
- Extending — opening the view-specific popup from a script and troubleshooting